MARIPOLDATA interactive dashboard: showing the evolution of the Marine Biodiversity field since 1990
Marine biodiversity science is central for current efforts to establish a new treaty for the protection and sustainable use of marine biodiversity beyond national jurisdiction (BBNJ). However, for a long time, a lack of scientific knowledge on the ocean was conceived as the main challenge for advancing efforts to protect ocean ecosystems. Nowadays the field is evolving quickly. New initiatives such as the Census of Marine Life or the Ocean Biogeographic Information System (OBIS) contributed to the rise of new data and a deeper understanding of the marine world and of its different components.
In order to understand how science has shaped international efforts to protect marine biodiversity, the MARIPOLDATA project combines the empirical study of international negotiations with a systematic analysis of the development and characteristics of the scientific field. Examining the role of science in international negotiations enables us to study and observe the role of science in the making of a new treaty and to shed light on how scientific capital influences the preferences of governments on how marine biodiversity ought to be protected, shared and sustainably used.
To this end, MARIPOLDATA (WP2) develops a large database of scientific publications related to marine biodiversity, analyzing the content of the publications, as well as international collaboration patterns in the discipline. The current blog serves as the first foray into our results and can be accessed here:
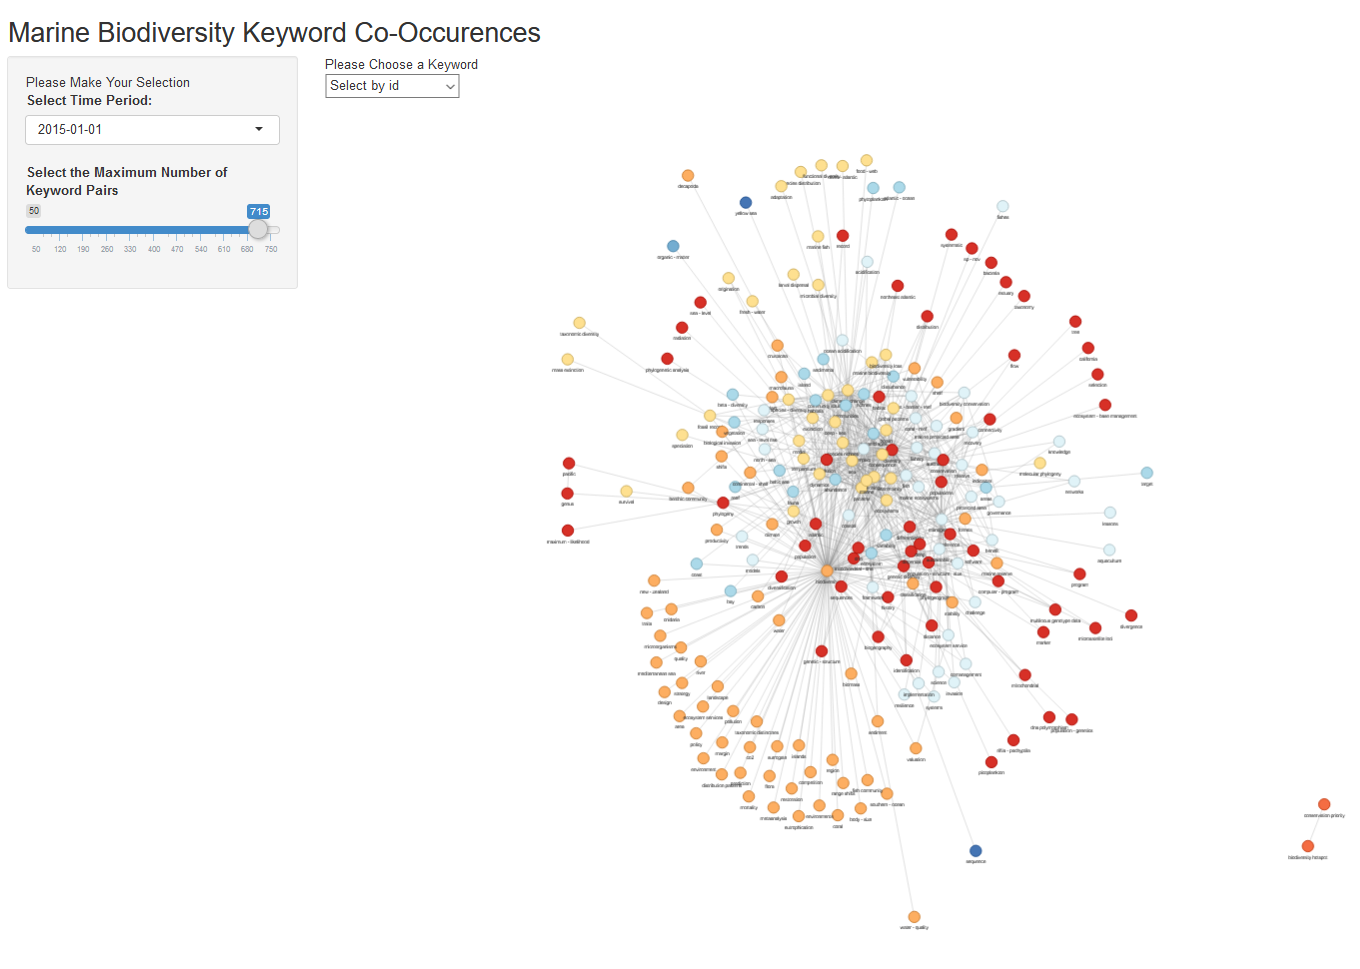
With this interactive entry, we show how the field of marine biodiversity has been evolving in the past 30 years in terms of content. Marine biodiversity can be defined as “an aggregation of highly interconnected ecosystem components or features, encompassing all levels of biological organization from genes, species, populations to ecosystems […]” (Cochrane et al. 2017).The interactive dashboard allows to dive deeper into this aggregation and the different aspects covered by the concept. The dashboard is designed to show what has been written about marine biodiversity, more specifically what keywords authors use, when writing scientific publications in the field, and how the keywords are related to each other. Since the field of marine biodiversity is a rather diverse in and of itself, this visualization allows to trace the patterns of keywords and the scope of the discipline, which was continuously increasing in the last 30 years.
This visualization is based on 26.000 scientific abstracts from 1990 until 2019 (retrieved from Web of Science), and you can choose any year within this time period to see whether the keywords, or their patterns of co-occurrence have changed over time. The keywords are connected if they appear, or “co-occur” in the same abstract. By default, the visualization shows the top (highest frequency) 100 keyword pairs from the selected year, but you can select to show top 50 to top 750 pairs.
The interactive dashboard will evolve over time with more functionality and more interesting data added. We will keep you posted.
Link to the dashboard: https://maripoldata.shinyapps.io/keywords_shiny/
(Note: the colors are mainly for aesthetic reasons and should not be over interpreted.)